This collectively written explanatory note by KAM Meghalaya on the economic crisis of Meghalaya is being shared with the hope that the citizens engage actively in thinking about the economy of our state. We have tried to explain economic terms and statistics rather than assume that the readers have a prior knowledge of those concepts.
INSTAGRAM GOVERNMENT
The Public Relations machinery of the Government of Meghalaya has been extra busy these days. MDA government led by Mr. Conrad Sangma has been badly hit by headlines of alleged corruption in its flagship loan financed government corporation and bad growth numbers. This was looking bad for a government that has replaced policy making with social media posts and paid public relations advertorials in magazines and websites.
Leaving aside The Meghalayan Age Ltd. and its multi-tasking super powerful bureaucrat until more information comes into the public domain, we would look at the bleak economic data for Meghalaya that the Reserve Bank of India has published.
If you are from Meghalaya, the experience of underdevelopment of our state is something for which we don’t have to wait for RBI numbers. Increasing migration of working population from the state, increasing underemployment, falling real wages, and bad nutritional status of the population all point to a failing economy. This is why all hell broke loose recently when a local newspaper put out the RBI data for Compounded Annual Growth Rate of Gross State Domestic Product (2011-2021) for a decade— data that estimated Meghalaya’s growth at approximately at 2%, the slowest in the country.

2% or 8.2% – SPINNING THE ECONOMY
The post became so viral that the IT cell of the government went around pasting similar sounding defensive messages on various social media platforms till the government’s own Public Relations department put out an infographic and press release about these RBI numbers and attempted to spin the bad news.
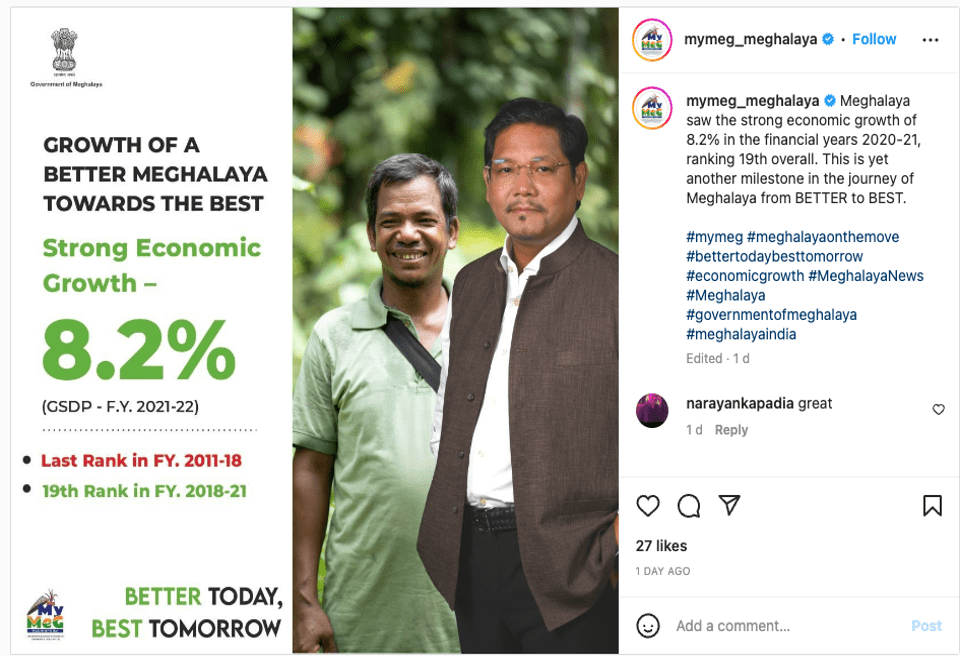
Apart from the fact Mr. Conrad Sangma is badly photoshopped in the picture – the infographic itself is full of intentional mistakes to confuse the citizens. What is 8.2% Economic growth? Is it for the year 2020-21 or of 2021-21? Is Meghalaya going from Better to Best in GSDP? Has Meghalaya’s growth rate jumped to 19th rank in India in 2018-21 from being last in the period of 2011-18?
If all this does not confuse you then the detailed press release will confuse you further.

We are sure Mark Twain had Meghalaya government in mind when he quipped
“There are three kinds of lies – Lie, White Lie and Statistics.”
Because our ruling elite believes that the common citizens do not necessarily engage with the abstruse world of economics and finance that they come up with such statistical sleight of hand to sow PR confusion in our public discourse.
So, what are these numbers? And what do they signify? What do these terms like GSDP, CAGR mean? Before we can unmask the number magic, let us try to understand some basic economic terms.
GDP/GSDP
Gross (State) Domestic Product (GDP/GSDP) is a measure in monetary terms. It indicates the total volume of all finished goods and services produced during a given period of time, usually a year, within the geographical boundaries of the country and the state. GDP is for the whole country, GSDP is for the state. GSDP provides a basic economic profile of the state and estimates the size of an economy and its growth rate.
This data is published annually by the government as well as the Reserve Bank of India. But if you look at the data you would find that there are two different tables, both carrying the same title of Gross State Domestic Product, one saying Gross State Domestic Product at Current Prices and other saying Gross State Domestic Product at Constant prices. Now why this confusion?

Let us consider a packet of chips. Five years ago, this chips packet, with a given number of chips made with the same unhealthy ingredients cost you ten rupees. you pay 20 rupees for the exact same product. Does it mean that the value of the same packet has gone up? Obviously not. What has happened is price rise or what economists call inflation.
So, the actual value of Gross State Domestic Product in a year can only be compared when we adjust the value for inflation. GSDP without taking into account inflation is called nominal GSDP or GSDP at Current Prices and when we adjust it for inflation, we call it Real GSDP or GSDP at Constant Prices. Constant Price is calculated according to the base year of 2011-2012 meaning comparing the price of goods and services now with the price of goods and services in 2011-12.
Let’s say the state had a nominal GSDP of 100 crores in 2012. By 2022, its nominal GSDP grew to Rs. 150 crores. But prices during this period also rose by 100% (10 rupees chips packet now cost Rs. 20). In this example, if you looked solely at its nominal GSDP, the country’s economy appears to be performing well. However, the real GSDP (expressed in 2012 rupees) would only be 75 crore rupees, revealing that there is an overall decline in real economic performance. Therefore, Real GSDP is a better method for expressing long-term economic performance. Let us look at Meghalaya’s GSDP, nominal and real in 2021-22
Nominal Rs.3,78,30,11,00,000
Real Rs.2,56,96,82,00,000
MYSTERIES OF ECONOMIC GROWTH
Economic Growth is by how much percentage our Domestic Product has grown between two time periods, usually a year. The most basic measurement is the annual growth rate. 8.2% that government claims that our economy has grown between 2021-22 is this number. So how did they calculate it?
In 2021 our GSDP at constant prices was Rs. 2375066 lakhs. In 2022 that became Rs. 2569682 lakhs, and so we can say that our economy grew by Rs. 194616lakhs. We are a small state with a small population, so our GSDP in absolute terms would be quite small compared to a big state like Maharashtra. This is why it is easier to compare growth across states or nations by percentages, rather than simply saying our economy grew by Rs. 194616 lakhs. Subtract GSDP of 2021 from GSDP in 2022 and divide the result by GSDP of 2021 and multiply it by hundred. And that is where 8.2% comes from.
8.2% is an impressive figure till we realise that we are comparing a non-covid year with covid years of 2020-21. Because of the disruptions to economic activity by CoVID19 the GSDP would have been low in 2021, so your rate of growth can seem more impressive. A better way to understand whether are doing well economically would be to compare our economic growth with other states in the same period. This year out of 33 States and Union territories only 21 states and Union territories reported their GSDP so the honour list looks something like this like this.
Table 1 Annual Growth Rate of Indian states 2021-2022

When you look at the list like this then the annual growth rate of 8.2% for the period 2021-22 starts looking average, even Bihar of BIMARU states has a higher growth rate at 11%. And what the press release and My Meg Instagram infographic doesn’t tell you is that all the states from Northeast that reported their GSDP are doing better than us.
Having understood the basic terms of economic analysis, we can now be much better placed to read the Compounded Annual Growth Rate (CAGR) reports for ourselves— rather than rely on government’s spin and propaganda. It is to this we will turn now.
CAGR OR LONG TERM GROWTH RATE
In the first part of this series, we explained the disparity between the MDA government’s optimistic report of Meghalaya’s economic performance in recent years against the reports of institutions such as the RBI, which suggest a far more dismal picture. While the RBI analysis indicates that Meghalaya is one of the slowest growing states in India, the government machinery has been hyping a figure of 8.2% growth over the last year! As we explained in the first part of this series, however, this is the growth rate for this year only. And this annual growth rate can fluctuate in different years. For example, if one particular year you took a massive loan, the GSDP can jump up substantially and if you were Meghalaya government you would pick and choose that year to show that our growth rate is impressive.
Anyway, economic growth needs to be seen in a longer term to know whether our economy is growing steadily or not growing at all. That where the idea of Compounded Annual Growth Rate (CAGR) comes in. It takes a period of usually a decade and averages out various annual growth rates. It is in CAGR that we can see a more holistic view of economic growth. CAGR is calculated by using this formula

where:
EV = Ending Value
BV= Beginning Value
n = Number of Years
To calculate the CAGR of State Domestic Product:
- Divide the value of State Domestic Product at the end of the period by its value at the beginning of that period.
- Raise the result to an exponent of one divided by the number of years.
- Subtract one from the subsequent result.
- Multiply by 100 to convert the answer into a percentage.
We have done the calculation for all the states of India based on the data released by the Reserve Bank of India.
Table 3 Compounded Annual Growth Rate for the Decade 2011-2021. Calculated from the data released by the Reserve Bank of India

Meghalaya is last. Our CAGR over the last 10 years is dismal 1.8% and this period includes governments of both Dr. Mukul Sangma and Conrad Sangma. This dismal growth rate points to serious structural issues with economy and economic policy in Meghalaya. And on this we will offer some comments at the end of this essay. But let us get back to the PR.
To score a petty political point, the MDA press release splits the CAGR for the Dr. Mukul (2011-18) period and the Conrad Sangma period (2018-22). It claims that,
“As per the RBI released data on GSDP of states, the compounded annual growth rate (CAGR) for Meghalaya’s GSDP during 2011-12 to 2017-18 was 2%, which was the lowest among all the States/UTs of India. However, the State grew at a faster rate during 2018-19 to 2020-21, with an impressive jump of 13 places nationally.”
This comparison is purely an electoral point and makes no economic sense. But let us see whether even this claim stands up to economic analysis. If we split the data in this periodisation two CAGRs. emerge. During 2011-2018 the average growth rate of GSDP at constant prices is 1.8% while in MDA period of 2018-21 the same CAGR drops to 0.05%. So,
1. Yes, it is true that during Dr. Mukul’s time in 2011-2018, Meghalaya had the lowest CAGR of 1.8%. For comparison, Mizoram had the highest CAGR of 10.7% in the whole country. We were 33rd out 33 states and Union Territories.
2. It is also true that during the 3-year period of MDA rule (2018-2021) Meghalaya climbed up by 12 places (not 19 places) to be 19th out of 31 states and union territories but the CAGR itself dropped for Meghalaya to half a percent.
So what do you prefer: jump in national ranking or decline in the growth rate? Our political bureaucratic class gives us no choice at all. It is either the devil or the deep sea.
SO, SHOULD WE CARE ABOUT THE GROWTH RATE?
Imagine a child of yours. Doctors tell us that children grow in height till they are sixteen or seventeen. Now if the child stops growing before that or is growing very slowly, we would get worried and take the child to the doctor.
Meghalaya’s economy if we go by the data is like that Child that has almost stopped growing. And that means that Meghalaya will step into its economic adulthood stunted, weak and with health deficiencies. We would need some serious medical (policy) intervention. But before we can start talking about this intervention, we need to look at one more piece of bad news.
BAD NEWS THAT PR MACHINE IGNORES (AND WE IGNORE IT TOO)
The per-capita GSDP shows how much economic production value can be attributed to each individual citizen. In simple words, it shows how prosperous citizens of a state are. The RBI report also talks of Net State Domestic Product. To understand the difference between Gross & Net, let us say you bought a scooter for 30000 rupees last year. Now the value of the scooter will depreciate with time. Perhaps it depreciated by 10000 rupees this year, and the net value of the scooter now is 20000 rupees. The same principle applies to State Domestic Product, we simply adjust the GSDP by subtracting the depreciation of all capital investment to arrive at NSDP. And if we divide the NSDP by the population of the state we get Per Capita NSDP. This shows how much income each person in our state has, atleast notionally.
And if we see the CAGR of per capita Net State Domestic Product for India, you realise how dire the situation is for us.
Table 4 Compounded Annual Growth Rate of Per Capita Net State Domestic Product at Constant Prices for the decade 2011-2021 calculated from the data released by Reserve Bank of India

If you want to see how special Meghalaya is just see the chart, we are the only state whose Growth Rate of Per Capita Income is below the zero.

Meghalaya is the only state in the country which has a negative CAGR of per capita income (-0.5%). People in our state are seeing a decline in their income over the last ten years. We are getting poorer in absolute terms by the year. And getting poorer is the situation both in Dr. Mukul’s times and in Conrad Sangma’s times. One of the reasons for this negative per capita income is obviously Meghalaya’s booming population but another is crossing the Rubicon into the Lamborghini capture of its economic life.
Just to understand this look at the value of Per Capita Income at Constant Prices for Meghalaya for the last ten years. For comparison, let us look at Per Capita Income of India and Sikkim, a state with which we share similar geographical and region locations. What you immediately notice is that our Per Capita Income is lower than National per Capita income and approximately one fifth of Sikkim’s per capita income. People of Sikkim at least by numbers are almost five times richer than us.
Table 5 Per Capita Income (Net State Domestic Product) at Constant Prices for the Decade for Meghalaya, Sikkim and India (Source: Reserve Bank of India)


And yet, in spite of dismal economic data, we have a small minority of Meghalayans who buy Lamborghinis and SUVs, erect gleaming glass fronted buildings, have swimming pools, watch world cup matches in Qatar, do their Christmas shopping in Dubai. Though the economic pie is very small for Meghalaya, a substantial section of it is grabbed its small ruling elite leaving crumbs for its working people. Just ask working people about the number of people in the family who have have to work to sustain themselves and the story of family poverty strikes you hard. And the data corroborates that. If we look at the Multidimensional Poverty Index for the states, we find that one third of our population (32.8%) is poor and experiences deprivation. So extreme inequality is at the very heart of the economic life of Meghalaya. That is why more young people are leaving the state for work, more children are getting stunted, more young people are dropping out of education, and more criminal activities like drug peddling are eating our everyday life.
So, what to make of this claim in the Press Release by the government
“The strong growth of Meghalaya can be attributed to the increase in government expenditure. Since 2018, the State government expenditure has doubled from Rs. 9,858 Cr in 2017-18 to Rs. 18,881 in 2022-23. An exponential increase in expenditure by almost 50% and large-scale investments taking place, have led the State to record an impressive growth and put the state on the national development pedestal.”
Obviously by now it must be clear to you that the Strong Growth that the press release is claiming should be taken with a fistful of salt. But the next claim of the rise in government expenditure needs to be unpacked. Much of this expenditure is being debt financed. If you remember that in the statement issued by the government about the controversy around The Meghalayan Age Ltd. talked about the loan of Rs 632 crores from the New Development Bank (NDB). Add the ADB loan to the World Bank loan and market borrowings— and this exponential increase vanishes into the thin air.
But much more worrying is the nature of this government expenditure. Quite a lot of this expenditure is going towards unplanned cash transfers that seem to have no long-term capital formation plans. So, one may have increased the government expenditure by 50% but the expenditure itself is plagued by short termism, wastefulness and unaccountable rent seeking behaviour by its political, bureaucratic class and its foot soldiers. Rent seeking is a nice sounding economics phrase for high level corruption and extortion.
In our rural areas small peasants are getting dispossessed of their land by a powerful indigenous class for illegal extractive economy and the persistence of rent seeking behaviour of its political, bureaucratic and their foot soldiers. Agricultural income is depressed because of the control of markets by the middlemen. Nothing in the economy seems to move without palms being greased. This High Level thrives with its control of street level petty extortion, government contracts, and check gate control, which is facilitated by its foot soldiers. This means that there is no private investment and in spite of the tall claims about the government expenditure and investment, it is clear that a lot of this expenditure lines the pockets of the powerful.
The recent story of stalled bypass roads because of extortionate cuts is revealing. The project cost would have been accounted for in the claims about 50% increase in government expenditure. The stalling, cuts, and lack of quality control, however, is not factored into the bureaucratic PR spin of the government.
But our MLAs and prospective MLAs are excitedly distributing one-time doles rather than working and thinking of policies that shall increase our growth rate and increase per capita income in a way that creates more employment and sustainable amenities and infrastructure for all so that citizens don’t have to be desperate for the doles from the politicians. Maybe that’s why politicians do not think of economic policies because they want working people to be their slaves. If we don’t want to live our lives precariously, we need to make the economy work for the people.
What makes us sad (and also worried) that the political parties of all hues do not seem to be addressing the fundamental issue of our everyday life that is economy. It is economy that feeds us, gives us jobs, educates us, looks after us. And yet the issues that they are flagging seem to exist in a vacuum where the economic crisis of Meghalaya that stares us does not exist. Can we at least start thinking about the economic implications of the various ideas that political parties seem to be floating. From ILP to Transport to Direct Benefit Transfers, Unemployment and Reservation Policy, Bifurcation of State and various others. How will the policy impact the economy? Will it pull us out of the economic dump we find ourselves in? How will it impact the one third of its poor working population that Meghalaya has? What about the family health and education expenditure? Capital formation? Illegal and grey economy? Inequality of wealth? Landlessness? How will they impact the job creation and real wages? Can Agriculture be revived? We can go on but you get the idea what we are driving at.
If we don’t ask these questions and provide sustainable policy responses to them, we are looking at a Meghalaya that is experiencing net outflow of young working population, declining health indicators, increasing hunger, expanding crime networks, drugs and violence eating our young generation…
Be First to Comment